Smart City Monitoring - Real-time Sensor Dashboard
This project demonstrates a complete real-time monitoring system for smart city infrastructure. Four Python sensor services generate simulated metrics that are collected by Prometheus and visualized in Grafana dashboards. The system showcases modern observability patterns with containerized microservices, metrics collection, and real-time visualization.
- Sensors: Python 3.11 with prometheus_client library
- Metrics Collection: Prometheus with 15-second scrape intervals
- Visualization: Grafana with auto-provisioned Prometheus datasource
- Orchestration: Docker Compose v3.8 with bridge networking
- Sensor Types: Traffic, Temperature, Air Quality, Smart Lights

Project goals
- Multi-service architecture with independent sensor containers
- Prometheus metrics collection from multiple endpoints
- Grafana dashboards for real-time visualization
- Time-based sensor behavior (day/night cycles for lights)
- Minimal but production-ready monitoring setup
Architecture overview
-
Traffic Sensors (Port 8001)
- 5 locations: Main_Street, Park_Avenue, Fifth_Avenue, Downtown, Highway_Exit
- Metric:
city_traffic_vehicleswith location and sensor_id labels - Updates every 10 seconds with random vehicle count (30-250)
-
Temperature Sensors (Port 8002)
- 4 districts (A, B, C, D) with 5 sensors each (20 total)
- Metric:
city_temperature_celsiuswith district, sensor_id, lat, lon labels - Base temperatures: A (22°C), B (21°C), C (24°C), D (20°C)
- Random variation: ±3°C from base temperature
- Updates every 15 seconds
-
Air Quality Sensors (Port 8003)
- 4 districts with PM2.5 and CO2 measurements
- Metrics:
city_air_quality_pm25,city_air_quality_co2with district labels - PM2.5 ranges: A (10-30), B (15-35), C (60-90), D (8-25)
- CO2 ranges: A (350-450), B (360-470), C (500-650), D (320-400)
- Updates every 20 seconds
-
Smart Lights Sensors (Port 8004)
- 4 districts with time-based behavior
- Metrics:
city_lights_on,city_lights_brightness_percentwith district labels - Daytime (6:00-20:00): 0-10 lights active, 0-30% brightness
- Nighttime: 80-100 lights active, 70-100% brightness
- Updates every 30 seconds
Metrics model
Each sensor exposes Prometheus metrics via HTTP endpoints:
# Traffic: city_traffic_vehicles{location="Main_Street", sensor_id="sensor_1"}
# Temperature: city_temperature_celsius{district="A", sensor_id="A-TEMP-001", lat="47.5", lon="19.0"}
# Air Quality: city_air_quality_pm25{district="C"} city_air_quality_co2{district="C"}
# Lights: city_lights_on{district="A"} city_lights_brightness_percent{district="A"}
Prometheus configuration
Prometheus scrapes all sensor endpoints every 15 seconds:
global:
  scrape_interval: 15s

scrape_configs:
  - job_name: traffic-sensors
    static_configs:
      - targets: ['traffic-sensor:8001']
  - job_name: temperature-sensors
    static_configs:
      - targets: ['temperature-sensor:8002']
  - job_name: airquality-sensors
    static_configs:
      - targets: ['airquality-sensor:8003']
  - job_name: lights-sensors
    static_configs:
      - targets: ['lights-sensor:8004']
Data flow lifecycle
- Python sensor scripts generate random metrics using prometheus_client
- Each sensor exposes HTTP endpoint on dedicated port (8001-8004)
- Prometheus scrapes metrics from all sensor endpoints every 15 seconds
- Metrics stored in Prometheus time-series database
- Grafana queries Prometheus via auto-provisioned datasource
- Dashboards visualize real-time data with configurable panels
- Sensors update metrics at different intervals (10s, 15s, 20s, 30s)
Grafana setup
- Auto-provisioned Datasource: Prometheus at
http://prometheus:9090 - Dashboard Panels:
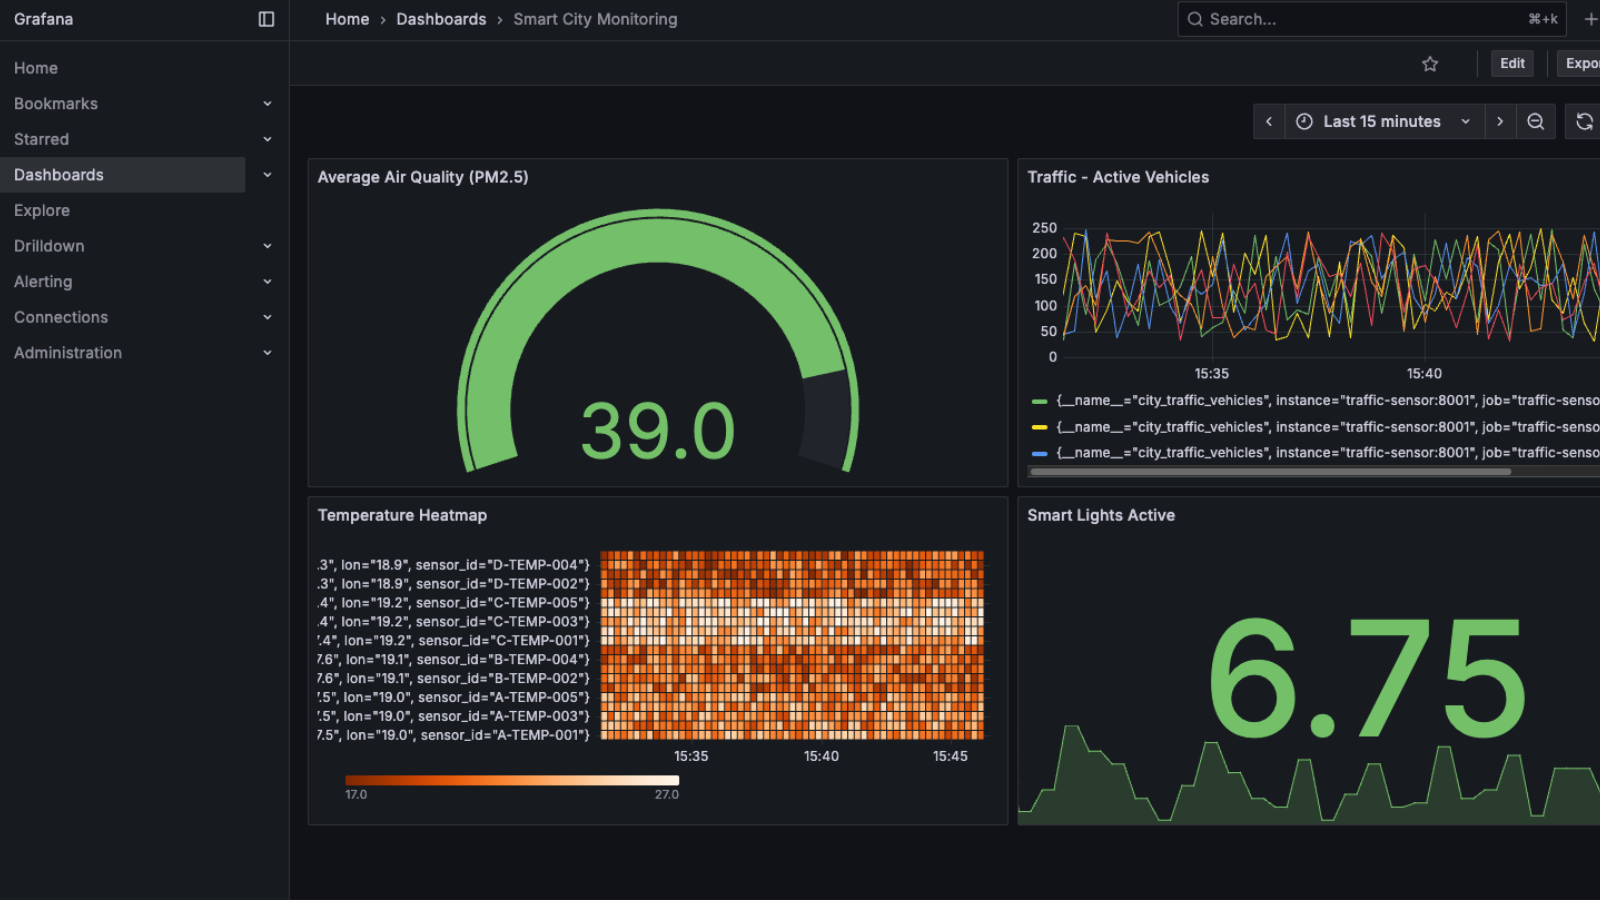
- Traffic: Line chart showing vehicle count across 5 locations
- Air Quality: Gauge display with color-coded thresholds (Green: 0-50, Yellow: 50-70, Red: 70+)
- Temperature: Heatmap visualization of 20 sensors across 4 districts
- Smart Lights: Stat panel showing active lights with day/night behavior
Operational concerns
- Local development:
docker-compose up --buildstarts all 6 services - Service discovery: Docker Compose service names resolve via bridge network
- Port management: Sensors (8001-8004), Prometheus (9090), Grafana (3000)
- Network isolation: All services on
monitoringbridge network - Volume mounts: Prometheus config and Grafana datasources mounted as read-only
- Environment: Grafana admin password set via environment variable
Security and reliability
- Network isolation: Services communicate only within Docker network
- Read-only mounts: Configuration files mounted as read-only volumes
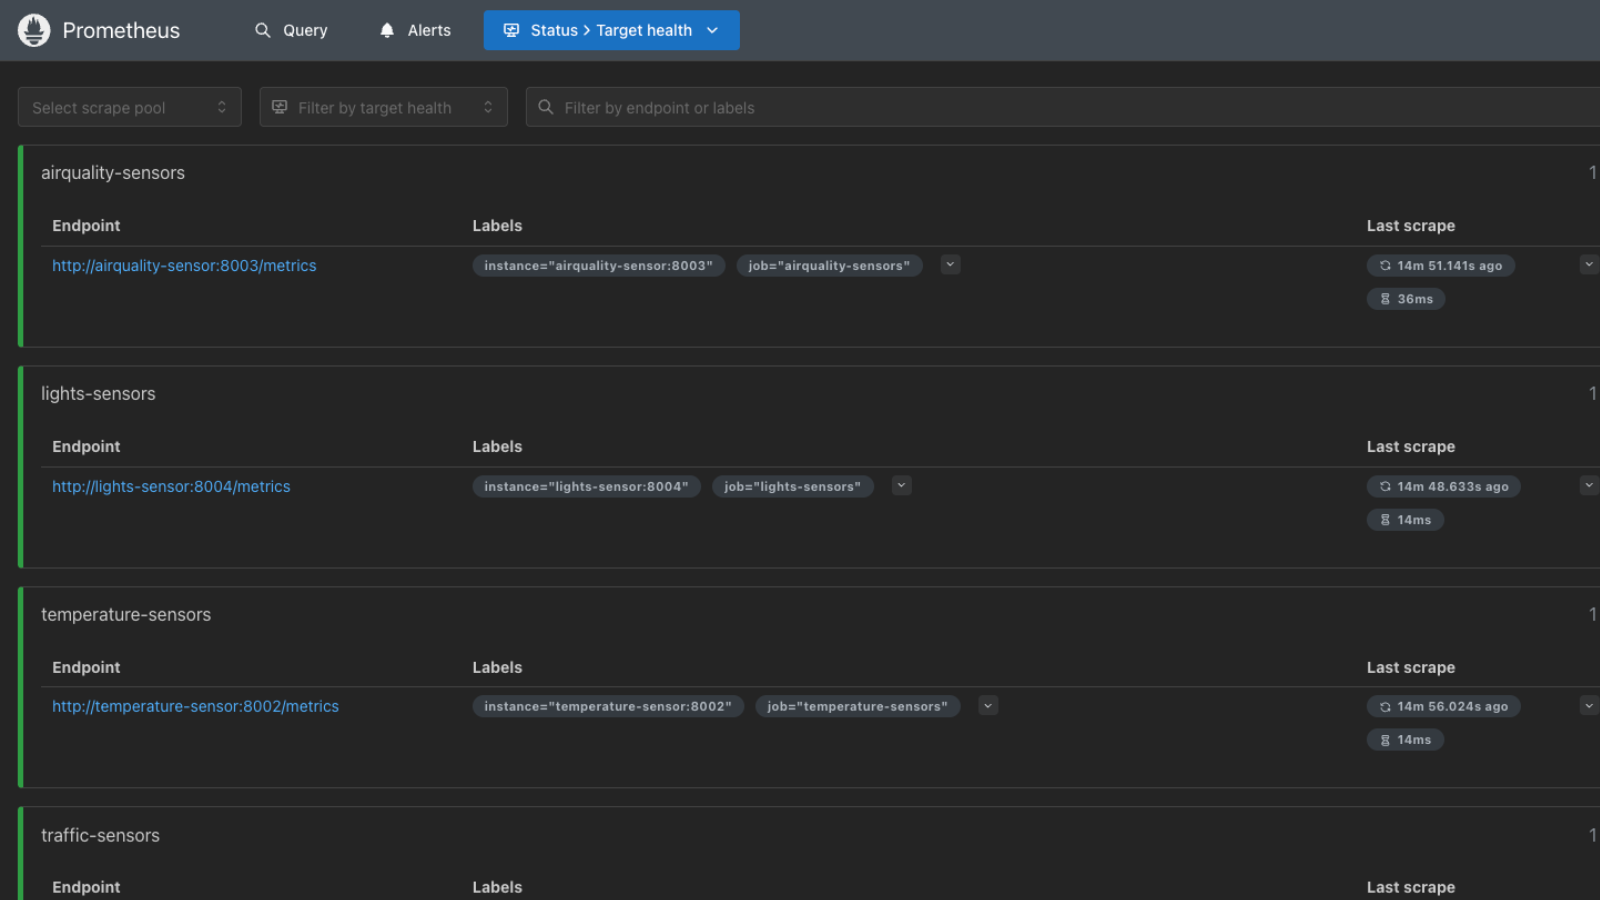
- Health monitoring: Prometheus tracks scrape success/failure for each target
- Error handling: Sensors continue running even if Prometheus temporarily unavailable
- No secrets: All configuration via Docker Compose (no sensitive data)
Performance notes
- Scrape intervals: 15-second global interval balances freshness vs load
- Sensor update rates: Different intervals (10-30s) match data characteristics
- Minimal dependencies: Only prometheus_client library per sensor
- Lightweight images: Python 3.11-slim base images for small container size
- No database: Prometheus handles time-series storage internally
Trade-offs and decisions
- Prometheus over InfluxDB: Simpler setup, built-in service discovery
- Python over Go: Easier to read and modify sensor logic
- Random data over real sensors: Demonstrates architecture without hardware
- Docker Compose over Kubernetes: Simpler for demo and local development
- Static config over dynamic discovery: Easier to understand and maintain
- Separate containers over single service: Better isolation and scaling

Running the project
-
Prerequisites
# Docker and Docker Compose installed docker --version docker-compose --version -
Start all services
docker-compose up --build # Services start in parallel: # - 4 sensor containers (traffic, temperature, airquality, lights) # - Prometheus (metrics collection) # - Grafana (visualization) -
Access services
# Grafana Dashboard open http://localhost:3000 # Login: admin/admin # Prometheus UI open http://localhost:9090 # Sensor metrics endpoints curl http://localhost:8001/metrics # Traffic curl http://localhost:8002/metrics # Temperature curl http://localhost:8003/metrics # Air Quality curl http://localhost:8004/metrics # Lights -
Verify Prometheus targets
# Check Prometheus targets page # http://localhost:9090/targets # All 4 sensor jobs should show "UP" status # Scrape interval: 15s -
Query metrics in Prometheus
# Traffic by location city_traffic_vehicles{location="Main_Street"} # Average temperature by district avg(city_temperature_celsius) by (district) # Air quality PM2.5 levels city_air_quality_pm25 # Active lights count sum(city_lights_on) by (district) -
Cleanup
docker-compose down

# Remove all containers and network
# Prometheus data and Grafana configs are ephemeral
Troubleshooting
- Port conflicts: Change ports in
docker-compose.ymlor free existing ports (8001-8004, 9090, 3000) - Prometheus targets down: Check sensor containers are running with
docker-compose ps - Grafana can't connect to Prometheus: Verify both services on same network, check datasource URL
- No metrics appearing: Wait for first scrape interval (15s), check sensor logs with
docker-compose logs - Sensor not updating: Check sensor logs for errors, verify Python script is running
- Network issues: Ensure all services on
monitoringnetwork, check withdocker network inspect
Notes
This project demonstrates how modern observability tools enable real-time monitoring of distributed systems. The separation of concerns—sensors generate metrics, Prometheus collects them, Grafana visualizes them—shows the power of the metrics collection pattern. The time-based behavior in the lights sensor shows how real-world systems adapt to environmental conditions.
The architecture scales horizontally: add more sensor containers, update Prometheus config, and Grafana automatically visualizes the new metrics. This pattern extends to production systems monitoring microservices, infrastructure, and business metrics.
The repository showcases production-ready monitoring patterns in a compact form—perfect for understanding Prometheus, Grafana, Docker Compose, and metrics-based observability.